
Support and Resistance Chart Patterns – In the dynamic world of financial markets, understanding chart patterns is essential for successful trading. Among the various chart patterns, support and resistance levels play a crucial role in technical analysis. These patterns help traders identify key levels where the price of an asset is likely to encounter obstacles or reverse its direction. By recognizing and interpreting support and resistance chart patterns, traders can make informed decisions and improve their trading strategies. In this article, we will delve into the concept of support and resistance chart patterns, explore their significance, and provide practical tips for utilizing them effectively.
Understanding Support and Resistance Levels
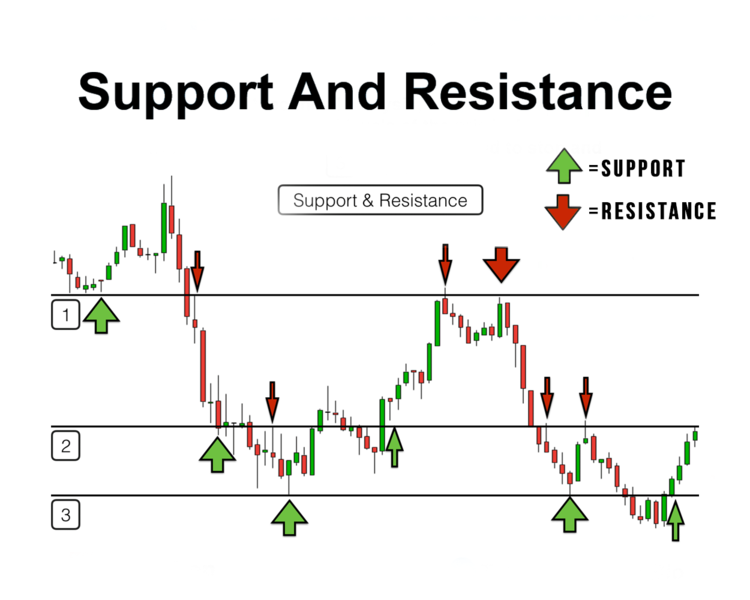
Support and resistance levels are significant price levels that act as barriers to the ongoing price movement of an asset. They represent areas where the supply and demand dynamics of the market tend to shift, causing the price to reverse or consolidate. Support levels are price levels at which buying pressure typically exceeds selling pressure, leading to a potential price increase. Conversely, resistance levels are price levels where selling pressure surpasses buying pressure, resulting in a potential price decrease.
Types of Support and Resistance Chart Patterns
1. Horizontal Support and Resistance
Horizontal support and resistance levels are formed when the price of an asset repeatedly tests and reverses at the same price level over a period of time. These levels indicate areas of strong buying or selling interest and can be visualized as horizontal lines on a price chart.
2. Diagonal Support and Resistance
Diagonal support and resistance levels, also known as trendlines, are formed by connecting consecutive swing highs or swing lows. These trendlines provide insights into the overall direction of the market and can act as support or resistance depending on the price’s position in relation to the trendline.
Identifying Support and Resistance Levels
1. Price Reversals
Price reversals occur when the price of an asset changes direction after reaching a support or resistance level. Traders can identify these reversals by analyzing candlestick patterns, chart formations, and the reaction of price at specific levels.
2. Volume Analysis
Volume analysis plays a crucial role in confirming support and resistance levels. Higher trading volumes near these levels suggest increased market interest and reinforce the significance of the identified levels.
3. Moving Averages
Moving averages, such as the 50-day or 200-day moving average, can act as dynamic support or resistance levels. When the price of an asset approaches these moving averages, it often experiences a reaction, indicating their importance as support or resistance.
Trading Strategies Using Support and Resistance
1. Breakouts and Bounces
Breakouts occur when the price of an asset breaks above a resistance level or below a support level. Traders can capitalize on breakouts by entering positions in the direction of the breakout. On the other hand, bounces involve trading near support or resistance levels with the expectation that the price will reverse from those levels.
2. Trend Reversals
Support and resistance levels can provide valuable insights into potential trend reversals. When an asset’s price breaks above a significant resistance level, it may indicate a bullish trend reversal. Conversely, when the price falls below a crucial support level, it may suggest a bearish trend reversal.
3. Range Trading
Range trading involves trading within the boundaries of established support and resistance levels. Traders identify buy or sell opportunities when the price approaches these levels, aiming to profit from the price oscillations within the range.
Risk Management and Stop-Loss Placement
To mitigate risks associated with trading support and resistance levels, proper risk management is crucial. Traders should determine appropriate stop-loss levels based on the distance between the entry point and the support or resistance level. This helps limit potential losses if the price breaks through these levels.
Support and Resistance Confirmation Indicators
Traders often use additional technical indicators to confirm support and resistance levels. These indicators can include oscillators, moving averages, trendlines, or volume-based indicators. The convergence of multiple indicators can strengthen the reliability of identified levels.
Combining Support and Resistance with Other Technical Analysis Tools
Support and resistance levels work in conjunction with other technical analysis tools, enhancing their effectiveness. Traders can combine them with indicators like moving averages, trendlines, and Fibonacci retracements to gain a comprehensive understanding of price movements and potential trading opportunities.
Case Studies and Examples
To illustrate the practical application of support and resistance chart patterns, we will examine real-life case studies and examples. These will showcase how traders successfully utilized these patterns to make informed trading decisions and capitalize on market opportunities.
Common Mistakes to Avoid
While trading support and resistance levels, traders should be aware of common pitfalls that can hinder their success. These mistakes include overreliance on a single indicator, ignoring broader market trends, failing to adapt strategies to changing market conditions, and inadequate risk management practices. Being mindful of these pitfalls can significantly improve trading outcomes.
Conclusion
Support and resistance chart patterns are powerful tools in a trader’s arsenal. By recognizing these patterns and understanding their significance, traders can identify potential entry and exit points, manage risks effectively, and enhance their trading strategies. With diligent analysis, practice, and continuous learning, traders can harness the power of support and resistance levels to achieve success in the financial markets.
Understanding and effectively utilizing support and resistance chart patterns are essential skills for traders in the financial markets. By identifying these levels, traders can gain insights into potential price reversals, breakouts, and range-bound trading opportunities. It is important to combine support and resistance analysis with other technical indicators, manage risks appropriately, and continuously adapt trading strategies to changing market conditions. With practice and a comprehensive understanding of support and resistance chart patterns, traders can enhance their trading performance and achieve success in the dynamic world of financial markets.
FAQs (Frequently Asked Questions)
1. How do I identify support and resistance levels on a price chart?
To identify support and resistance levels, you can look for price levels where the price has reversed multiple times or areas where the price has consolidated or stalled. These levels can be horizontal or diagonal in nature.
2. Can support levels become resistance levels and vice versa?
Yes, support levels can become resistance levels if the price breaks below the support level and then later retraces back to that level. Similarly, resistance levels can become support levels if the price breaks above the resistance level and subsequently pulls back to that level.
3. Are support and resistance levels equally effective for all financial instruments?
Support and resistance levels are applicable to various financial instruments such as stocks, currencies, commodities, and cryptocurrencies. However, the effectiveness of these levels may vary depending on the liquidity and trading volume of the instrument.
4. How can I use support and resistance levels in conjunction with other technical indicators?
Support and resistance levels can be combined with other technical indicators like moving averages, trendlines, and oscillators to increase the probability of accurate predictions. These indicators can provide additional confirmation or divergence signals when analyzing price movementsand potential trading opportunities.
5. Is it necessary to use support and resistance levels in every trading strategy?
While support and resistance levels are valuable tools, they are not mandatory in every trading strategy. Traders can choose to incorporate them based on their preferred approach and the market conditions they are trading in. It’s essential to consider a holistic view of the market and combine various technical analysis tools to make well-informed trading decisions.


