Candlestick Pattern Guide for Traders – Candlestick patterns have become a popular tool for traders to analyze and predict market trends. In this article, we will explore the history, anatomy, and application of candlestick patterns in technical analysis.
Candlestick Pattern Guide for Traders
Introduction to Candlestick Patterns
Candlestick charts were first used by Japanese rice traders in the 18th century. They used these charts to track the price movements of rice in the spot market. Candlestick charts gained popularity in the Western world in the 20th century, thanks to the work of Steve Nison, who introduced the concept of candlestick patterns in his book, “Japanese Candlestick Charting Techniques.”
Anatomy of a Candlestick
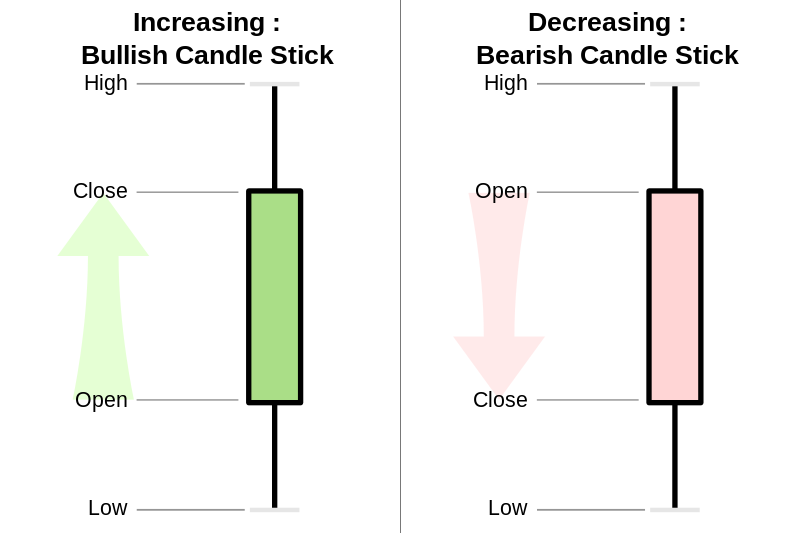
A candlestick consists of three parts: the body, the wick, and the tail. The body represents the opening and closing prices of an asset, while the wick and tail represent the high and low prices, respectively. The color of the body indicates whether the price of the asset has gone up or down. A white or green body represents a bullish trend, while a black or red body represents a bearish trend.
Types of Candlestick Patterns
Candlestick patterns can be categorized into two types: reversal patterns and continuation patterns. Reversal patterns indicate a change in the direction of the trend, while continuation patterns suggest that the trend will continue. Some of the popular candlestick patterns include:
Reversal Patterns
- Hammer
- Hanging Man
- Inverted Hammer
- Shooting Star
- Doji
- Evening Star
- Morning Star
Continuation Patterns
- Bullish/Bearish Engulfing
- Three White Soldiers/Three Black Crows
- Rising/Falling Three Methods
- Bullish/Bearish Harami
- Piercing Line
- Dark Cloud Cover
How to Trade Using Candlestick Patterns
Candlestick patterns can be used to identify entry and exit points for trades. Traders can use these patterns in conjunction with other technical indicators to confirm the strength of a trend. It is important to note that candlestick patterns are not always accurate and should be used in conjunction with other forms of analysis.
Conclusion
Candlestick patterns are a powerful tool for traders to analyze and predict market trends. They provide valuable insights into the psychology of the market and can be used in conjunction with other technical indicators to make informed trading decisions. It is important for traders to understand the anatomy and types of candlestick patterns before using them in their analysis.
FAQs
What is the difference between a bullish and bearish candlestick?
- A bullish candlestick has a white or green body, indicating that the price of the asset has gone up. A bearish candlestick has a black or red body, indicating that the price of the asset has gone down.
Can candlestick patterns be used for long-term trading?
- Yes, candlestick patterns can be used for long-term trading, but they should be used in conjunction with other forms of analysis.
Are candlestick patterns always accurate?
- No, candlestick patterns are not always accurate and should be used in conjunction with other forms of analysis.
How can I learn more about candlestick patterns?
- There are many resources available online, including books, courses, and videos, that can help you learn more about candlestick patterns.
Can candlestick patterns be used in any market?
- Yes, candlestick patterns can be used in any market, including stocks, forex, commodities, and cryptocurrencies.


