
MacD Divergence Utilizing it in Trading Strategies – In the world of technical analysis, traders often rely on various indicators to identify potential trends and opportunities in the financial markets. One such indicator that has gained popularity among traders is the Moving Average Convergence Divergence (MACD). MACD is a versatile tool that can provide valuable insights into market trends and help traders make informed decisions. This article aims to provide a comprehensive understanding of MACD divergence and how it can be effectively used in trading strategies.
What is MACD?
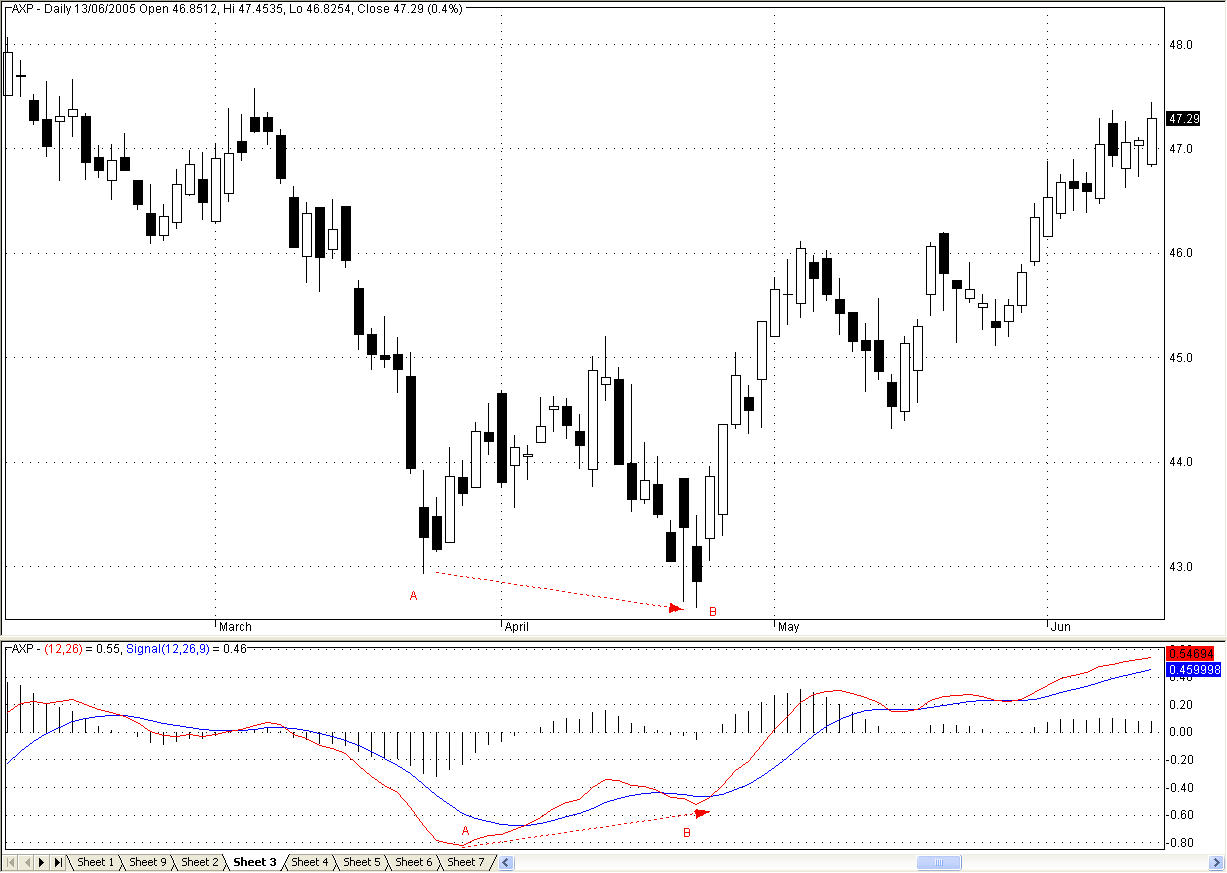
The Moving Average Convergence Divergence (MACD) is a popular trend-following momentum indicator used in technical analysis. It consists of two lines: the MACD line and the signal line. The MACD line is calculated by subtracting the 26-period Exponential Moving Average (EMA) from the 12-period EMA, while the signal line is a 9-period EMA of the MACD line. Traders use MACD to identify potential buy and sell signals in the market.
How Does MACD Work?
MACD works by capturing the relationship between two moving averages. When the MACD line crosses above the signal line, it generates a bullish signal, indicating that it may be a good time to buy. On the other hand, when the MACD line crosses below the signal line, it produces a bearish signal, suggesting a possible selling opportunity.
Understanding MACD Divergence
MACD divergence occurs when the price of an asset diverges from the MACD indicator. It indicates a potential reversal or weakening of the current trend. Divergence can be either bullish or bearish, depending on the direction of the price and the MACD indicator.
Types of MACD Divergence
Regular Bullish Divergence
Regular bullish divergence occurs when the price forms lower lows while the MACD indicator forms higher lows. This suggests that the selling pressure is weakening, and a bullish reversal may be imminent.
Regular Bearish Divergence
Regular bearish divergence occurs when the price forms higher highs while the MACD indicator forms lower highs. This indicates that the buying pressure is diminishing, and a bearish reversal might be on the horizon.
Hidden Bullish Divergence
Hidden bullish divergence occurs when the price forms higher lows while the MACD indicator forms lower lows. It signifies a continuation of the existing bullish trend and can be seen as a buying opportunity during pullbacks.
Hidden Bearish Divergence
Hidden bearish divergence occurs when the price forms lower highs while the MACD indicator forms higher highs. It indicates a continuation of the existing bearish trend and can be used as a selling opportunity during temporary rallies.
Identifying MACD Divergence
Traders can identify MACD divergence by visually analyzing the price chart and the MACD indicator. By comparing the swing highs and swing lows of the price with the corresponding peaks and troughs of the MACD indicator, divergence patterns can be recognized.
Using MACD Divergence in Trading Strategies
MACD divergence can be a powerful tool in trading strategies. Traders can utilize it in various ways, such as:
- Confirming trend reversals
- Identifying potential entry and exit points
- Adding confluence to other technical indicators
- Filtering out false signals
- Assessing the strength of a trend
Case Studies: Real-Life Examples
In this section, we will explore real-life examples where MACD divergence provided valuable insights and assisted traders in making informed trading decisions. Through these case studies, you will gain a practical understanding of how MACD divergence can be applied effectively in different market scenarios.
Common Mistakes to Avoid
While using MACD divergence, traders should be aware of common pitfalls and mistakes that can lead to incorrect interpretations. This section will highlight some of the common mistakes and provide guidelines to avoid them, ensuring accurate analysis and decision-making.
Advanced Techniques for MACD Divergence Analysis
For experienced traders seeking to delve deeper into MACD divergence analysis, this section will explore advanced techniques and strategies. By incorporating these techniques into their trading arsenal, traders can enhance their ability to identify and capitalize on divergence patterns.
Combining MACD Divergence with Other Indicators
To further refine trading strategies, traders often combine MACD divergence with other technical indicators. This section will discuss popular indicators that complement MACD divergence analysis, enabling traders to obtain a more comprehensive view of the market.
MACD Divergence on Different Timeframes
The effectiveness of MACD divergence may vary across different timeframes. Traders need to understand how divergence signals can differ on various timeframes and adjust their strategies accordingly. This section will provide insights into interpreting MACD divergence on different timeframes.
MACD Divergence in Different Financial Markets
MACD divergence is not limited to a specific financial market. It can be applied to various asset classes, including stocks, currencies, commodities, and cryptocurrencies. This section will explore the application of MACD divergence across different markets, allowing traders to expand their trading opportunities.
Tips for Successful MACD Divergence Trading
To maximize the effectiveness of MACD divergence in trading, it is essential to follow certain best practices. This section will provide practical tips and guidelines for successful MACD divergence trading, helping traders achieve consistent results and mitigate risks.
Conclusion
MACD divergence is a valuable tool that can enhance trading strategies and provide valuable insights into market trends. By understanding the different types of divergence, identifying divergence patterns, and utilizing MACD divergence in conjunction with other indicators, traders can gain a competitive edge in the financial markets.
FAQs
1. How often does MACD divergence occur?
MACD divergence can occur frequently, depending on the volatility and price movements of the asset being analyzed. Traders should regularly monitor the charts to identify potential divergence patterns.
2. Can MACD divergence be used as a standalone indicator?
While MACD divergence can provide valuable signals, it is often beneficial to combine it with other technical indicators for confirmation and to reduce false signals.
3. Is MACD divergence suitable for all traders?
MACD divergence can be useful for both beginner and experienced traders. However, it is recommended to practice and gain experience in interpreting divergence patterns before incorporating them into trading strategies.
4. Can MACD divergence predict the exact timing of market reversals?
MACD divergence provides indications of potential reversals, but it does not guarantee precise timing. Traders should use it in conjunction with other tools and techniques for comprehensive analysis.
5. Where can I access MACD divergence indicators?
Most charting platforms and technical analysis software provide MACD divergence indicators as part of their toolkit. Traders can readily access and utilize these indicators to identify divergence patterns.


