
RSI Indicator A Powerful Tool for Technical Analysis – In the world of financial markets, technical analysis plays a crucial role in helping traders and investors make informed decisions. Among the many tools available, the Relative Strength Index (RSI) indicator stands out as a powerful tool that provides valuable insights into market trends and potential price reversals. In this article, we will delve into the RSI indicator, its calculation, interpretation, and practical applications for traders.
RSI Indicator: A Powerful Tool for Technical Analysis
Understanding Technical Analysis
Technical analysis is a method used by traders and investors to forecast future price movements based on historical market data. It involves analyzing patterns, trends, and statistical indicators derived from price and volume data. Technical analysis assumes that historical price patterns tend to repeat, and by studying these patterns, traders can identify potential trading opportunities.
Introduction to the RSI Indicator
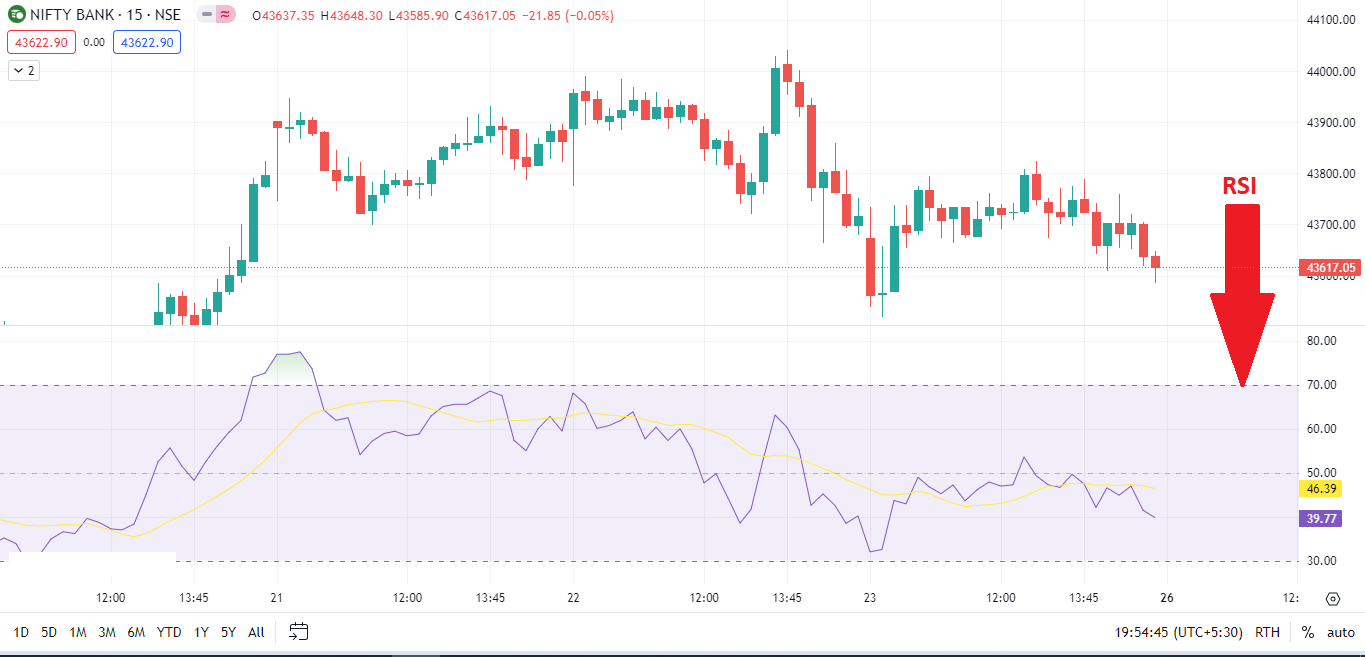
The Relative Strength Index (RSI) is a popular technical indicator developed by J. Welles Wilder Jr. in the late 1970s. It is a momentum oscillator that measures the speed and change of price movements. The RSI indicator oscillates between 0 and 100, providing insights into whether an asset is overbought or oversold.
Calculation of the RSI Indicator
The RSI indicator is calculated using a mathematical formula that compares the magnitude of recent gains and losses over a specified period. The most common period used is 14, but traders can adjust it according to their trading style and time frame. The RSI formula involves several steps:
- Calculate the average gain and average loss over the specified period.
- Calculate the relative strength (RS) by dividing the average gain by the average loss.
- Calculate the RSI by using the formula: RSI = 100 – (100 / (1 + RS))
Interpreting RSI Readings
RSI readings can provide valuable insights into the strength and direction of price movements. When the RSI is above 70, it is generally considered overbought, indicating a potential price reversal or a correction in the near future. Conversely, when the RSI is below 30, it is considered oversold, suggesting a potential price increase or a bounce back.
Overbought and Oversold Conditions
Identifying overbought and oversold conditions using the RSI indicator can help traders determine when a particular asset is due for a price correction or a trend reversal. However, it is important to note that overbought or oversold conditions alone are not sufficient to make trading decisions. Traders should look for additional confirmation signals before taking action.
Using RSI for Divergence Analysis
Divergence analysis is a technique that involves comparing the direction of price movements with the direction of the RSI indicator. Bullish divergence occurs when the price forms lower lows, but the RSI indicator forms higher lows. This can be an early indication of a potential trend reversal to the upside. Conversely, bearish divergence occurs when the price forms higher highs, but the RSI indicator forms lower highs, suggesting a potential trend reversal to the downside.
RSI as a Confirmation Tool
The RSI indicator can also be used as a confirmation tool in conjunction with other technical indicators. For example, if a trader identifies a bullish trend using a moving average crossover strategy, they can use the RSI to confirm the strength of the trend. If the RSI is in the overbought zone, it may indicate that the trend has become overstretched and a pullback is likely.
Combining RSI with Other Technical Indicators
Traders often combine the RSI indicator with other technical indicators to enhance their trading strategies. For instance, combining the RSI with moving averages, trendlines, or support and resistance levels can provide additional confirmation signals and increase the probability of successful trades. Experimentation and backtesting are essential to find the optimal combination of indicators for specific trading styles and assets.
Applying RSI in Trend Identification
The RSI indicator can be a useful tool for identifying trends in the market. By analyzing the RSI’s behavior during trending periods, traders can gain insights into the strength and sustainability of a trend. Higher highs and higher lows in the RSI often accompany an uptrend, while lower highs and lower lows indicate a downtrend.
RSI Strategies for Trading
Traders employ various RSI-based strategies to generate trading signals. Some common strategies include RSI divergences, RSI trendline breaks, RSI overbought/oversold conditions, and RSI moving average crossovers. Each strategy has its own advantages and limitations, and traders should thoroughly test and refine their approach before implementing it in live trading.
RSI for Risk Management
In addition to its role in generating trading signals, the RSI indicator can assist traders in managing risk. For example, by setting stop-loss orders based on RSI levels, traders can limit potential losses if a trade goes against their expectations. Additionally, the RSI can be used to identify potential exit points or take-profit levels.
Backtesting and Optimization of RSI Strategies
Before applying any RSI-based strategy, it is crucial to backtest and optimize the strategy using historical data. Backtesting allows traders to evaluate the performance of the strategy under different market conditions. Optimization involves adjusting the parameters of the strategy to maximize its profitability. However, it is essential to exercise caution and avoid over-optimization, as it may lead to curve-fitting and poor performance in real-time trading.
Limitations of RSI Indicator
While the RSI indicator is a powerful tool, it does have its limitations. The RSI is best suited for trending markets and may generate false signals in sideways or choppy markets. Traders should also be aware that the RSI is a lagging indicator, meaning it reacts to past price data. Therefore, it is essential to consider other factors and use the RSI in conjunction with other technical indicators for a comprehensive analysis.
Common Mistakes to Avoid when Using RSI
When using the RSI indicator, traders should be mindful of common mistakes that can affect their trading decisions. Some of these mistakes include relying solely on overbought or oversold conditions, ignoring other technical indicators or price patterns, using a fixed RSI period for all assets and timeframes, and not considering the overall market context. Traders should aim for a holistic approach and integrate the RSI indicator within a comprehensive trading strategy.
Conclusion
The Relative Strength Index (RSI) indicator is a versatile and widely used tool in technical analysis. It helps traders identify overbought and oversold conditions, divergence patterns, and trends in the market. By incorporating the RSI into their trading strategies, traders can enhance their decision-making process and increase their chances of successful trades. However, it is crucial to use the RSI in conjunction with other technical indicators and consider the limitations and nuances of the market. Continuous learning, practice, and adaptability are key to mastering the effective use of the RSI indicator in the dynamic world of financial markets.
FAQs (Frequently Asked Questions)
- What is the optimal period for calculating the RSI?
- The most commonly used period for RSI calculation is 14, but it can be adjusted based on individual preferences and trading timeframes.
- Can the RSI be used for all types of financial instruments?
- Yes, the RSI can be applied to various financial instruments, including stocks, commodities, currencies, and cryptocurrencies.
- Is the RSI indicator suitable for long-term investing?
- While the RSI is primarily used for short-term trading, it can also provide insights into potential long-term trend reversals or entry points.
- Can the RSI indicator predict future price movements with certainty?
- No, the RSI indicator is not a crystal ball and cannot predict future price movements with certainty. It provides probabilities and potential signals that require further analysis and confirmation.
- Where can I access RSI indicator tools and charts?
- Many trading platforms and charting software offer built-in RSI indicators. Additionally, numerous online resources provide free access to RSI charts and related tools.


