What’s the Japanese Candlestick Pattern – If you are interested in trading, then you must have come across the term “Japanese candlestick patterns.” In this article, we will discuss what exactly Japanese candlestick patterns are, how they originated, and how traders use them to make informed trading decisions.
What’s the Japanese Candlestick Pattern / What’s the Japanese Candlestick Pattern
What are Japanese Candlestick Patterns?
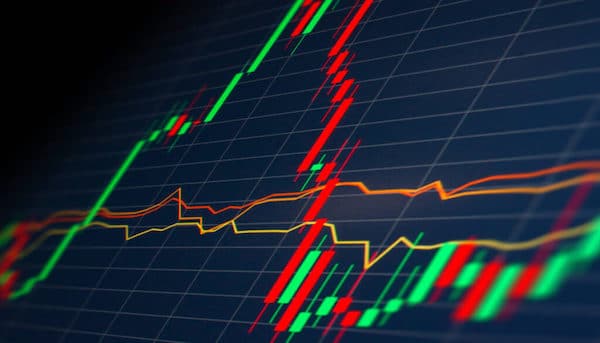
Japanese candlestick patterns are a type of technical analysis tool used by traders to understand the price action of a stock or any financial asset. The Japanese candlestick chart is a representation of the price movement of an asset over a specific period. It displays the opening, closing, high, and low price of the asset.
Japanese candlestick patterns use the same data as the traditional bar chart, but the representation is more visual, making it easier to interpret. The patterns can be bullish or bearish, indicating whether the buyers or sellers are in control.
The Origin of Japanese Candlestick Patterns
Japanese candlestick patterns originated in Japan in the 18th century, where they were used to trade rice futures. The technique was called “Sakata Rules” after Munehisa Homma, a Japanese rice trader from the city of Sakata, who used these techniques to accumulate a vast fortune. He documented the patterns he observed, which formed the basis of the modern-day Japanese candlestick chart.
How Japanese Candlestick Patterns Work
Japanese candlestick patterns work by showing the relationship between the opening, closing, high, and low price of an asset. Each candlestick represents a specific period, usually a day or a week, and displays the opening, closing, high, and low price of that period. The body of the candlestick is the difference between the opening and closing price, and the wick or shadow represents the high and low price for that period.
Traders use the patterns to identify potential trend reversals or continuations, which can help them make better trading decisions. The patterns can be bullish or bearish, indicating whether the buyers or sellers are in control.
Types of Japanese Candlestick Patterns
There are various types of Japanese candlestick patterns, and each has its interpretation. Here are some of the most common Japanese candlestick patterns:
1. Doji
A Doji is a candlestick pattern that occurs when the opening and closing price of an asset are almost the same. It indicates indecision in the market and can be a signal of a potential trend reversal.
2. Hammer
A Hammer is a bullish candlestick pattern that occurs when the price of an asset opens and closes near the high, with a long lower shadow. It indicates that buyers have taken control of the market and can be a signal of a potential trend reversal.
3. Shooting Star
A Shooting Star is a bearish candlestick pattern that occurs when the price of an asset opens and closes near the low, with a long upper shadow. It indicates that sellers have taken control of the market and can be a signal of a potential trend reversal.
4. Engulfing Pattern
An Engulfing Pattern is a candlestick pattern that occurs when a small candle is followed by a larger candle that completely engulfs it. It can be a signal of a potential trend reversal.
How to Use Japanese Candlestick Patterns in Trading
Traders use Japanese candlestick patterns to identify potential trend reversals or continuations. They do this by looking for specific patterns that indicate a change in market sentiment. Traders can use the patterns in conjunction with other technical analysis tools such as moving averages or Fibonacci retracements to make better trading decisions.
Conclusion
Japanese candlestick patterns are an essential tool for traders to understand the price action of an asset. The patterns can help traders identify potential trend reversals or continuations and make better trading decisions. The visual representation of the patterns makes it easier for traders to interpret and analyze the price movement of an asset.
It’s essential to note that Japanese candlestick patterns should not be used in isolation when making trading decisions. They should be used in conjunction with other technical analysis tools and fundamental analysis to get a more holistic view of the market.
FAQs
- Can Japanese candlestick patterns be used for all financial assets?
Yes, Japanese candlestick patterns can be used for all financial assets, including stocks, forex, and commodities.
- How reliable are Japanese candlestick patterns?
Japanese candlestick patterns are a reliable tool for traders to understand the price action of an asset. However, they should not be used in isolation and should be used in conjunction with other technical analysis tools and fundamental analysis.
- Can Japanese candlestick patterns be used for day trading?
Yes, Japanese candlestick patterns can be used for day trading. Traders can use the patterns to identify potential trend reversals or continuations and make better trading decisions.
- Do Japanese candlestick patterns work in all market conditions?
Japanese candlestick patterns can work in all market conditions, but they should not be used in isolation. Traders should use them in conjunction with other technical analysis tools and fundamental analysis.
- Do I need to be an expert to use Japanese candlestick patterns?
No, you don’t need to be an expert to use Japanese candlestick patterns. However, you should have a basic understanding of technical analysis and how to interpret the patterns.
Final Thoughts
Japanese candlestick patterns are an essential tool for traders to understand the price action of an asset. They can help traders identify potential trend reversals or continuations and make better trading decisions. However, traders should not rely solely on Japanese candlestick patterns and should use them in conjunction with other technical analysis tools and fundamental analysis. By doing so, they can get a more holistic view of the market and make more informed trading decisions.


